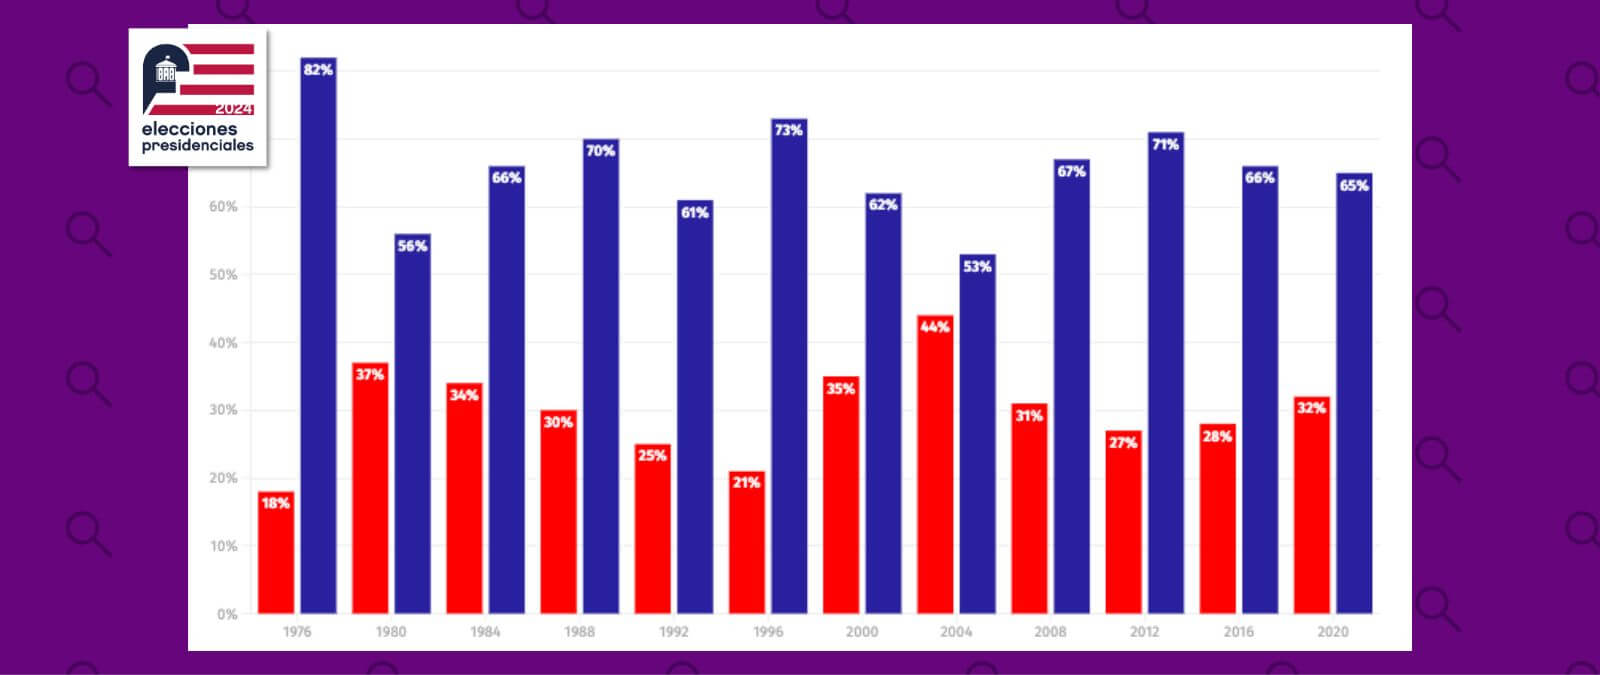
There are 36 million Latinos eligible to vote in 2024. We don't know who they’ll choose in the next elections, but we do know who they voted for in the past. According to data from the Roper Center, an investigation center from the University of Cornell, since 1976, Latinos have mostly voted for a democratic presidential candidate. In other words, the democrats have won the “Latino vote” in 12 consecutive presidential elections.
Si quieres leer esta nota en español haz clic aquí.
However, this doesn't mean this will always be the case: in 2004, President George W. Bush got 44% of the Latino votes, which was the best result in history for a Republican candidate. Additionally, in the last presidential elections in 2020, President Donald Trump got the second-best result for a republican after Bush, with 32% of the votes.
Presidents who got the highest percentages of Latino votes: Carter, Clinton and Obama
The most popular candidate among Latinos in history was the Democrat former president Jimmy Carter, who got 82% of the Latino votes in the election in 1976. However, when he ran again 4 years later, his Latino support went down significantly - he only got 56% of votes, and this contributed to his defeat against Ronald Reagan.
After Carter, the most popular ex-presidents among Latinos were Bill Clinton (got 73% in 1996) and Barack Obama (71% in 2012). On the other hand, in the last 44 years there were only two Republican candidates who got more than 33% of Latino votes: former presidents Ronald Reagan and George W. Bush. They both got this percentage in the two elections in which they ran.
Latino turnout in elections has been growing, but it’s still less than in other groups
Besides counting how many people vote and which candidate they choose, in elections, the turnout is also measured, meaning the percentage of eligible people to vote who actually vote. When it comes to Latino turnout, we saw a record in the last presidential election in 2020: 52.5% of the eligible people voted.
This number is the highest ever according to the University of Florida Election Lab, but we need to look at it with some perspective: even though it’s shown a tendency to grow in the past decades, the Latino participation rate in presidential elections has been significantly lower than that of non-Hispanic white people and non-Hispanic black people in all elections since 1988.
https://flo.uri.sh/visualisation/17054961/embed?auto=1
To sum up, like we’ve told you in Factchequeado, the number of Latino voters and their influence in elections has been growing non-stop in the last 2 decades. If we compare the 2024 election to the previous one 4 years ago, there will be 4 million more Latinos eligible to vote.
Factchequeado is a verification media outlet built by a Spanish-speaking community to tackle disinformation in the United States. Do you want to be part of it? Join us and verify the content you receive by sending it to our WhatsApp +16468736087 or to factchequeado.com/whatsapp.


